Histogram Meaning
The histogram in photography is a graphical representation of the tonal distribution of an image. It represents the number of pixels in an image according to their brightness, allowing the photographer to quickly assess exposure.
The histogram illustrates the tonal distribution through a graph, where the horizontal axis represents the range of tones from black to white and the vertical axis shows the number of pixels in each of these tones. This allows you to identify whether a photo is well balanced in terms of brightness.
The colour histogram(RGB) extends the capabilities of the classic brightness chart by showing the distribution of values for the three primary colour channels: red (Red), green (Green) and blue (Blue). These channels can be displayed separately or as overlapping layers, giving a complete picture of the photograph's colour composition.
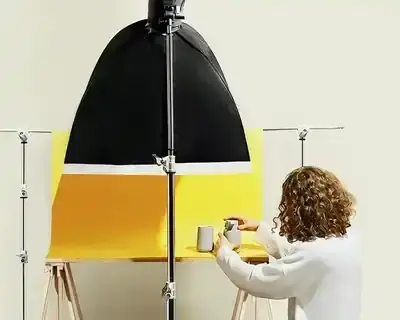
Exposure example - 9 Photos


The image shows doughnuts on a pink background. The chart therefore shows a dominance of bright red tones, which corresponds to the background and surface of the doughnuts. The green and blue channels are also noticeable, but in smaller values, which adds a warm colour to the whole scene.


The image shows coffee, croissants and doughnuts on a beige background. The graph shows an even distribution of colours with a predominance of warm red and green tones, characteristic of the wooden table and the golden hue of the croissants.


This image shows confetti scattered on a yellow background. The histogram clearly highlights the intense values in the red and green channels, which dominate as they are responsible for the background colour. The high values in the blue channel are less noticeable, adding contrast to the coloured confetti.


In the image, we see shiny baubles in a glass on a green background. The chart therefore shows a predominance of blue and green tones, indicating pastel shades dominating the background and objects.


A photo with a hand and a box on a red-blue background. The chart here is quite specific, with a lot of bright reds, which corresponds to the bright background. The low green and blue values emphasise the minimalism of the photo.


A peculiar scene showing a flower in a vase in front of a mirrored frame. The graph shows a predominance of red and blue, which accounts for the colour of the flowers and the soft pastel background.


Colourful pendants in the shape of controllers on an orange and pink background. The graph highlights the large presence of red, which is responsible for the background and the overall tonality, while green and blue are present but in smaller proportions.


The image shows a pink background, pink flowers and a glass of pink wine. The chart indicates a high dominance of red and pink tones, with a moderate addition of green and blue.


The final image shows a birthday cake on a pastel background. The graph shows a clear dominance of red, which is characteristic of the pastel and warm tones in the photo. Blue and green are present in smaller values, highlighting the variety of colours.
Colours on the histogram
The colour chart (RGB) extends the capabilities of the classic brightness chart by showing the distribution of values for the three primary colour channels: red (Red), green (Green) and blue (Blue). These channels can be displayed separately or as overlapping layers, giving a complete picture of the colour composition of the photograph.
Interpreting the RGB histogram
On the RGB graph, the areas of overlap between the channels create the derived colours. When red and blue overlap, magenta is created, the combination of blue and green creates cyan, and red and green gives yellow. Overlapping all three channels creates white or grey.
Check also:
Elements of the histogram
The tonal graph consists of several key elements: shadows, halftones and lights. The shadows are on the left hand side, the halftones in the middle and the lights on the right hand side of the graph.

Histogram for Analysing Your Images
It is an invaluable tool in image analysis as it allows you to assess exposure and contrast. It can be used to identify overexposure or underexposure, which is key to achieving correctly exposed images.
Classic histogram In Photography
Interpretation of the X Axis (dark to Light Tones)
The X axis of the histogram represents the tonal range of the photo, from dark tones on the left to light tones on the right. This helps to quickly identify whether an image is too dark or too light.
Interpretation of the Y-Axis (number of Pixels for Each Tone)
The Y-axis of the graph shows the number of pixels for each tone, which allows you to judge how many pixels are in a particular tonal range. High values on the Y-axis indicate a high number of pixels in a given tonal area, which may suggest dominance in the image.
Identifying Over- and Under-Exposures
Overexposures show up on the graph as a clustering of data on the right, while underexposures appear on the left. The ability to recognise these features on the histogram is crucial for correct exposure settings.
Examples of Different Types of histograms (high-Contrast, Low-Contrast)
High-contrast graphs are characterised by a wide distribution of data, with large differences between dark and light tones. Low-contrast graphs, on the other hand, have more concentrated data, indicating a smaller tonal range in the image.
In-Camera histogram
The in-camera histogram is usually available on the image preview screen. Different camera models offer different ways of displaying the histogram, allowing you to quickly assess the exposure.
If you don't see this display on your camera it doesn't mean you don't have one. Check your settings.

Histogram and Exposure
This tool is invaluable when selecting exposure parameters such as shutter speed, aperture and ISO. It allows you to monitor tonal distribution in real time, which is crucial in difficult lighting conditions.
Check also:
In bright light, it helps to avoid overexposure by indicating when to reduce exposure. In low light it allows you to adjust settings to avoid underexposure.
When to Trust the histogram
This camera feature is most useful in situations where there are high contrasts in the image. It gives an instant indication of whether the photo is correctly exposed, which is crucial during photo shoots.
Histogram in Photoshop
How Do I Enable the histogram?
To enable the histogram in Adobe Photoshop, go to the'Window' menu and select 'Histogram'. The histogram will appear as a panel that can be placed anywhere on the screen, making it easy to keep an eye on it at all times during editing.
Image Editing
This tool is crucial during post-production, as it allows you to accurately assess the tonal distribution of the photo you are editing. It allows you to quickly identify areas that need correction, such as overexposure or underexposure.

Tone Correction and Exposure
This Photoshop tool that supports tonal correction and exposure by visualising changes in real time. It allows you to fine-tune brightness and contrast, which is helpful in achieving the desired end result.
Curve Adjustment
Adjusting levels and curves using It allows you to fine-tune the tones in your image. With this tool you can easily identify which areas need to be brightened or darkened.

Advanced histogram
Creating Customised Tonal Profiles
One advanced technique for working with the histogram is to create custom tonal profiles, which adjust the tonal range to suit your specific needs . This allows you to achieve a unique look for your photos that can be difficult to achieve with standard settings.

Using the histogram in HDR (High Dynamic Range) Techniques
The histogram is crucial in HDR techniques, where it helps to balance the wide tonal range. this analysis allows you to accurately combine multiple exposures into a single image, which is essential for a natural HDR look.
When working with HDR, make sure that the graph does not show too much overexposure, which will result in a loss of detail.
Dominant Colour
RGB charts allow you to identify the dominant colours in a photo and correct them. This allows you to identify which colours are too intense and adjust them for more balanced colours.